Data to decisions. One flow.
Category trends, competitor visuals, price bands, and style signals—plan next-season assortment and design direction with clarity.
- Trends
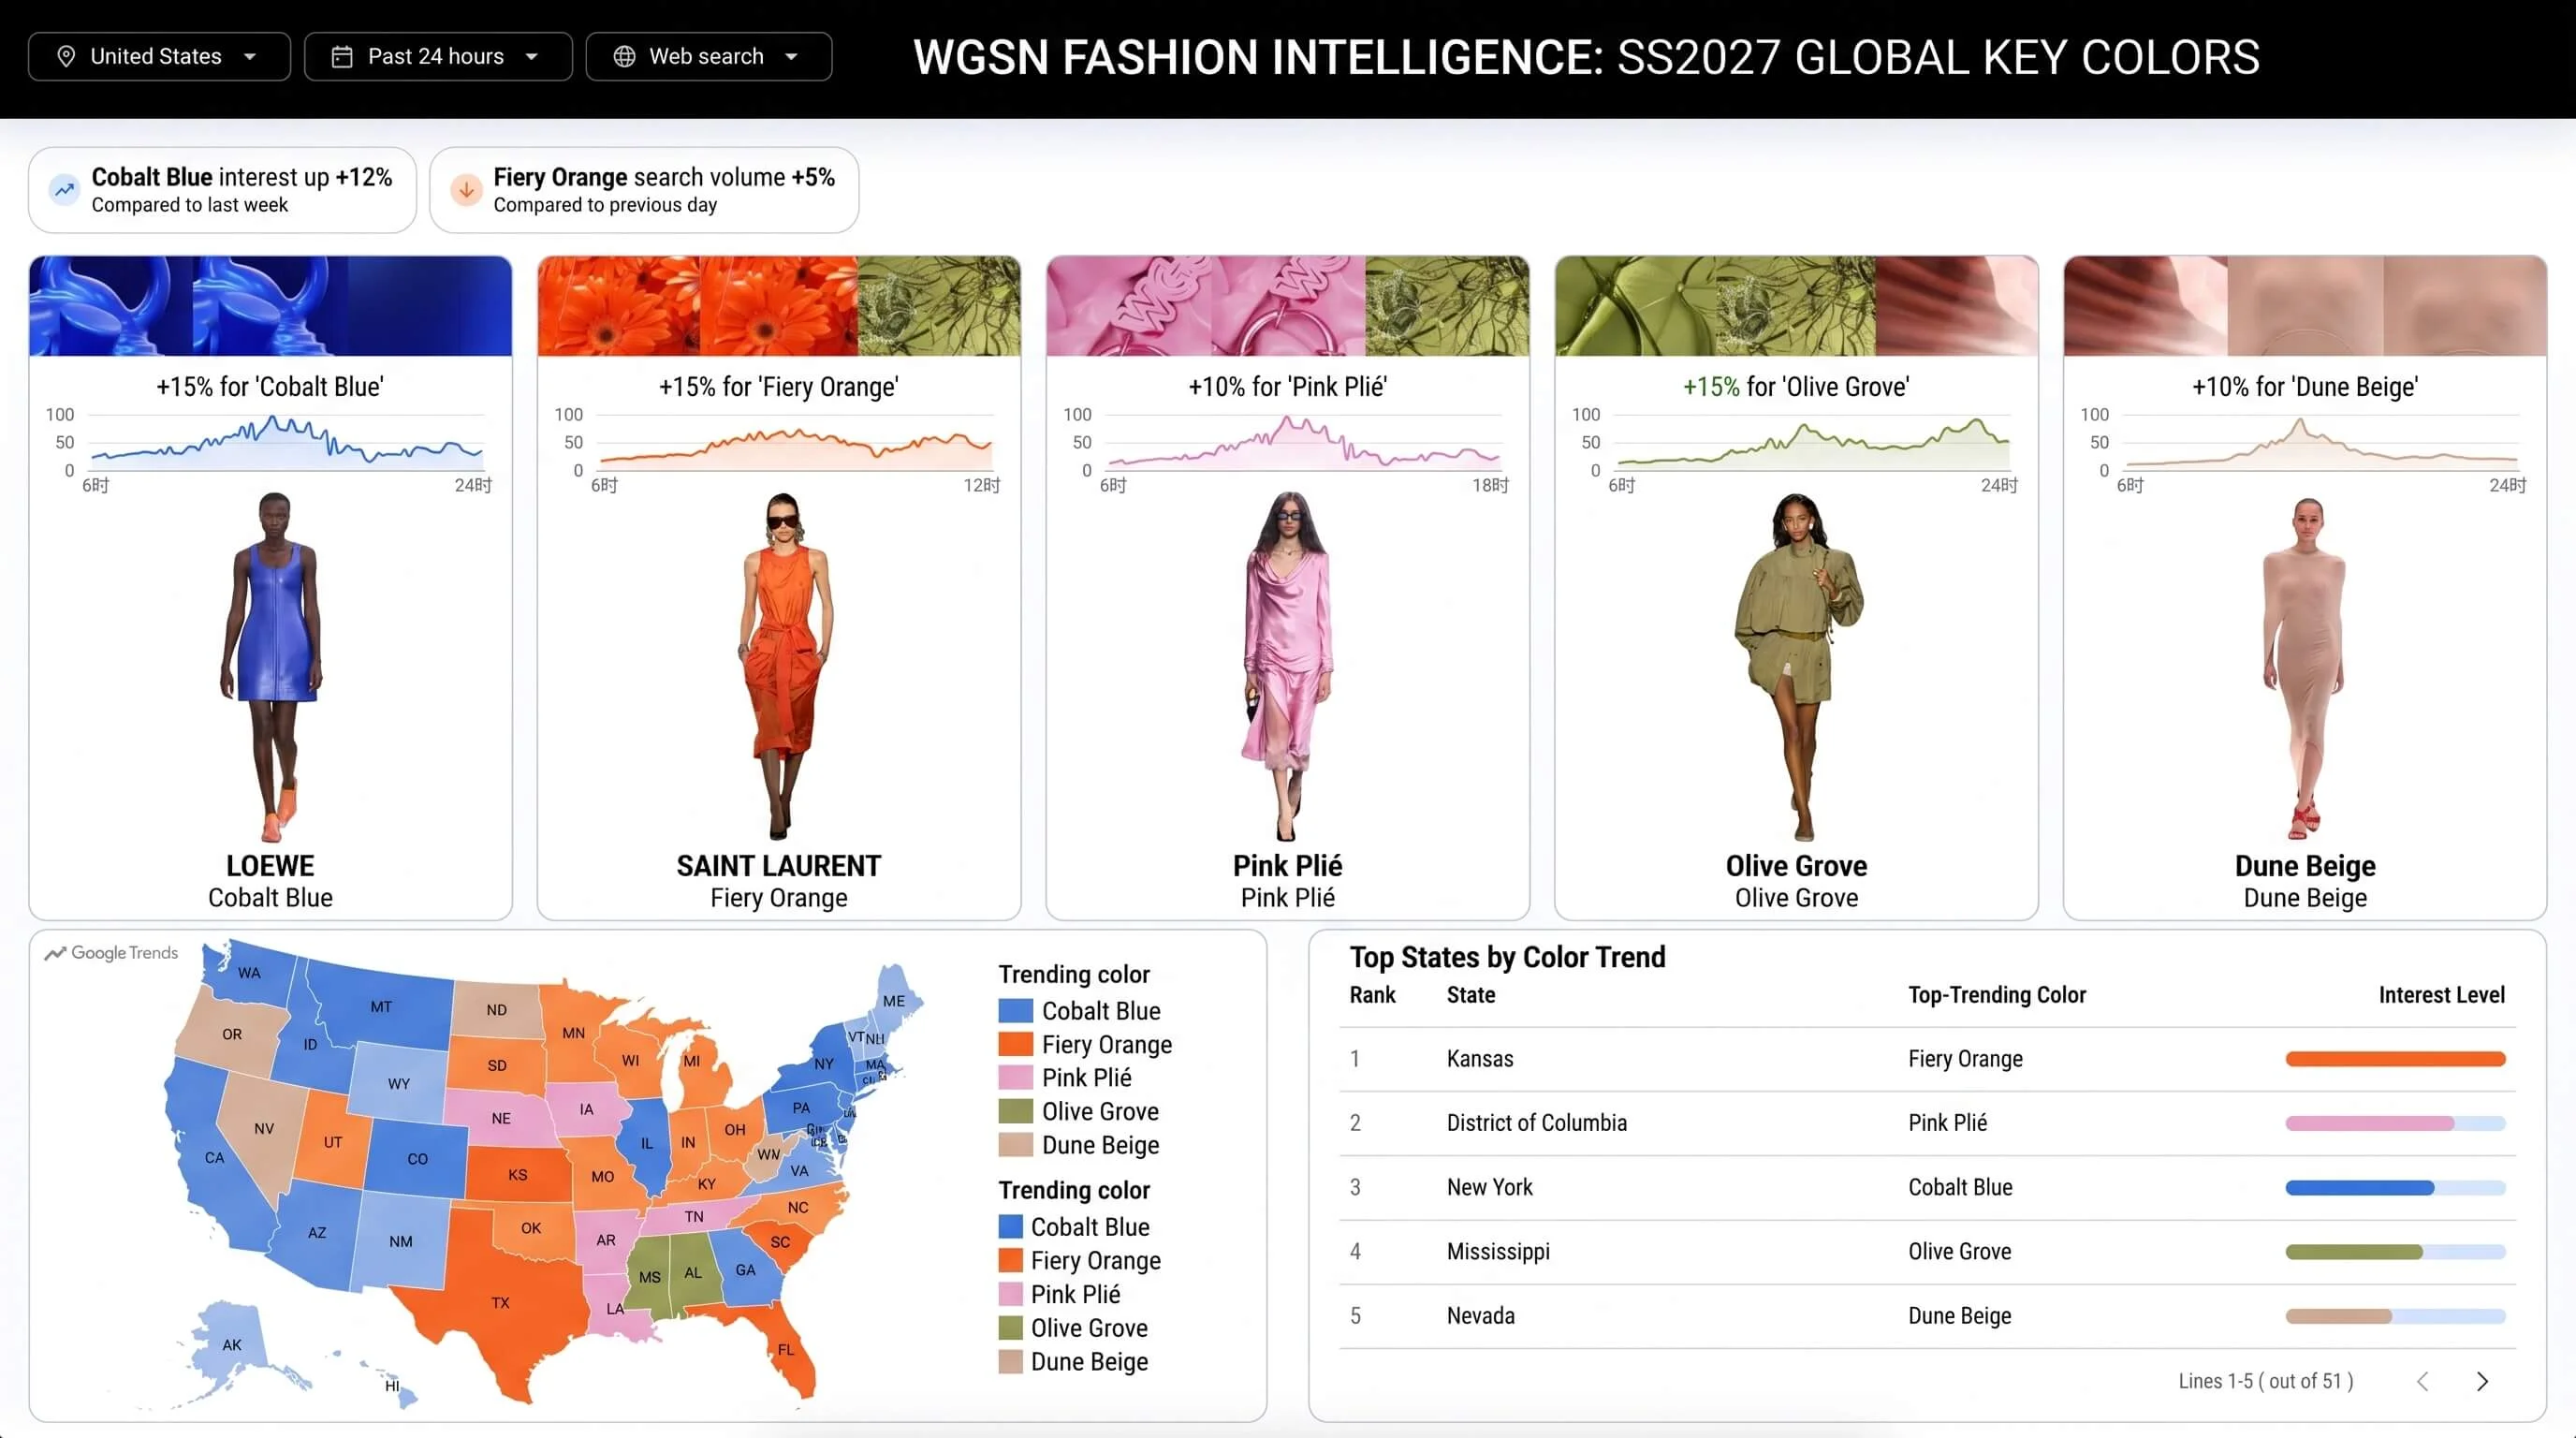
Category trends in real time
Hot keywords, colors, and forms across social and e-commerce—inform quarterly planning.
- Assortment
Matrix-driven gap filling
SKU gaps by price, style, material, and occasion—hero and long-tail mixes for next season.

- Competitive
Competitor visuals at a glance
Launches, hero styles, and pricing moves—comparison moodboards without long research cycles.

- Forecast
Seasonal demand guidance
History, trend signals, and holiday calendars guide depth and width of assortment bets.
- Brief
Insights into design briefs
Trend and assortment conclusions become moodboards and briefs—skip re-interpreting spreadsheets.


One canvas
Trend monitoring, competitor analysis, assortment planning, and brief output—one workspace.
Category trend monitoring
Color, form, material, and occasion hot terms by season.
Assortment matrix analysis
SKU distribution and gaps by price, style, and channel.
Competitor visual aggregation
Launches and hero styles into comparison moodboards.
Price band analysis
Dominant market ranges for pricing and style planning.
Trend moodboard generation
Data insight into visual boards designers use immediately.
Design brief export
One-click briefs plugged into Artilora design workflows.
Integrations
Reads from or exports to common analytics and commerce tools.